REQUEST COMPLIMENTARY SQLS*PLUS LICENCE
Azure Databricks
Databricks is an analytical service based on the open source Apache Spark project. Databricks was used to absorb a significant amount of data. In February 2018, integration between Azure and Databricks appeared. This integration provides data science and data engineers with a fast, simple Spark-based sharing platform in Azure.
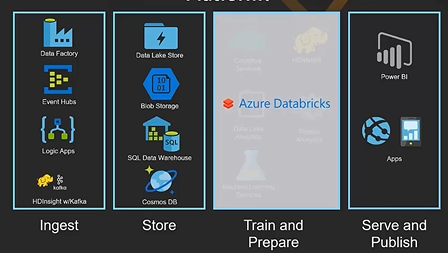
Azure Databricks is a new platform for large data analytics and machine learning. Azure Databricks is suitable for data engineers, data scientists and business analysts. This post and the next one will provide an overview of what Azure Databricks is. We will show you how the environment is designed and how to use it for data science.
What is Azure Databricks?
Create Azure Databricks in an Azure environment. Sign in to one of your Azure accounts and create the Azure Databricks module.
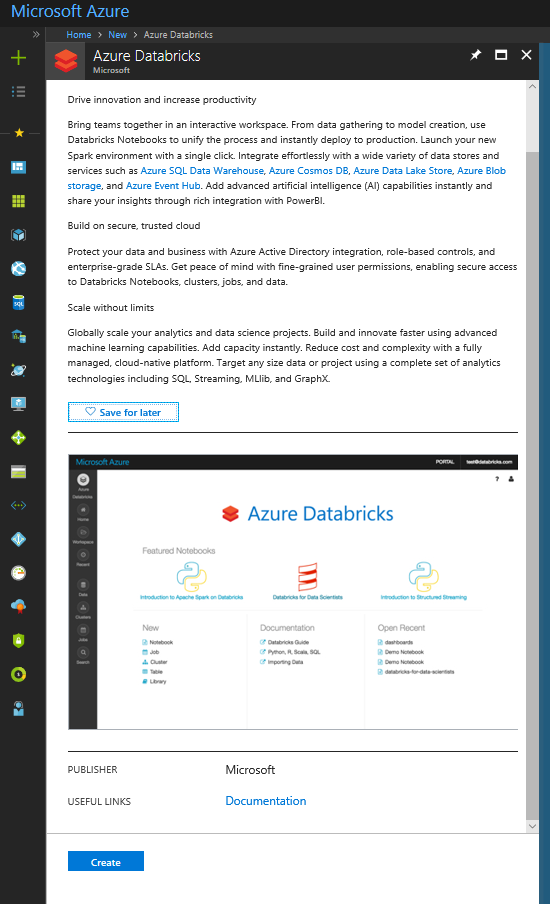
To access Azure Databricks, select Launch Workspace.
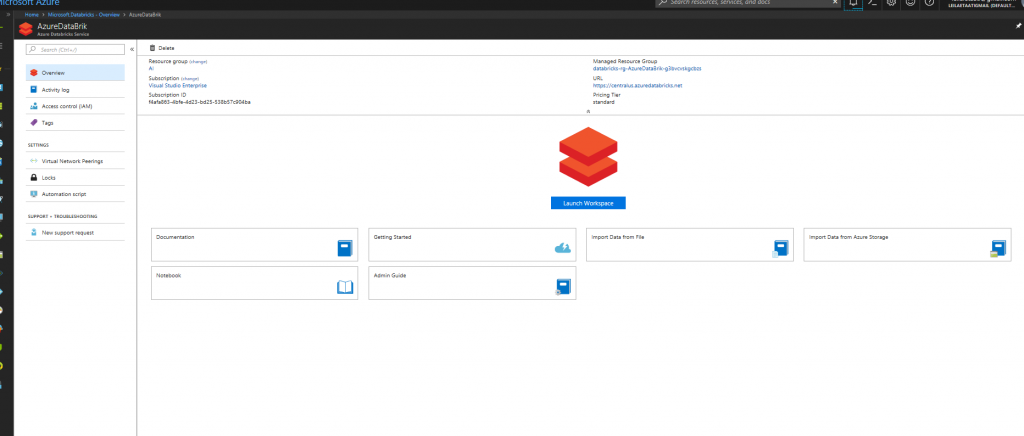
As you can see in the figure below, the Azure Databricks environment has different components. The main components are Workspace and Cluster. The first step is to create a cluster. Clusters in Databricks provide a single platform for ETL (Extract, transform and load), thread analytics and machine learning. The cluster has two types: Interactive and Job. Interactive clusters are used for collaborative data analysis. However, Job clusters are used for fast and reliable automatic loading using the API.
The cluster page can contain both types of clusters
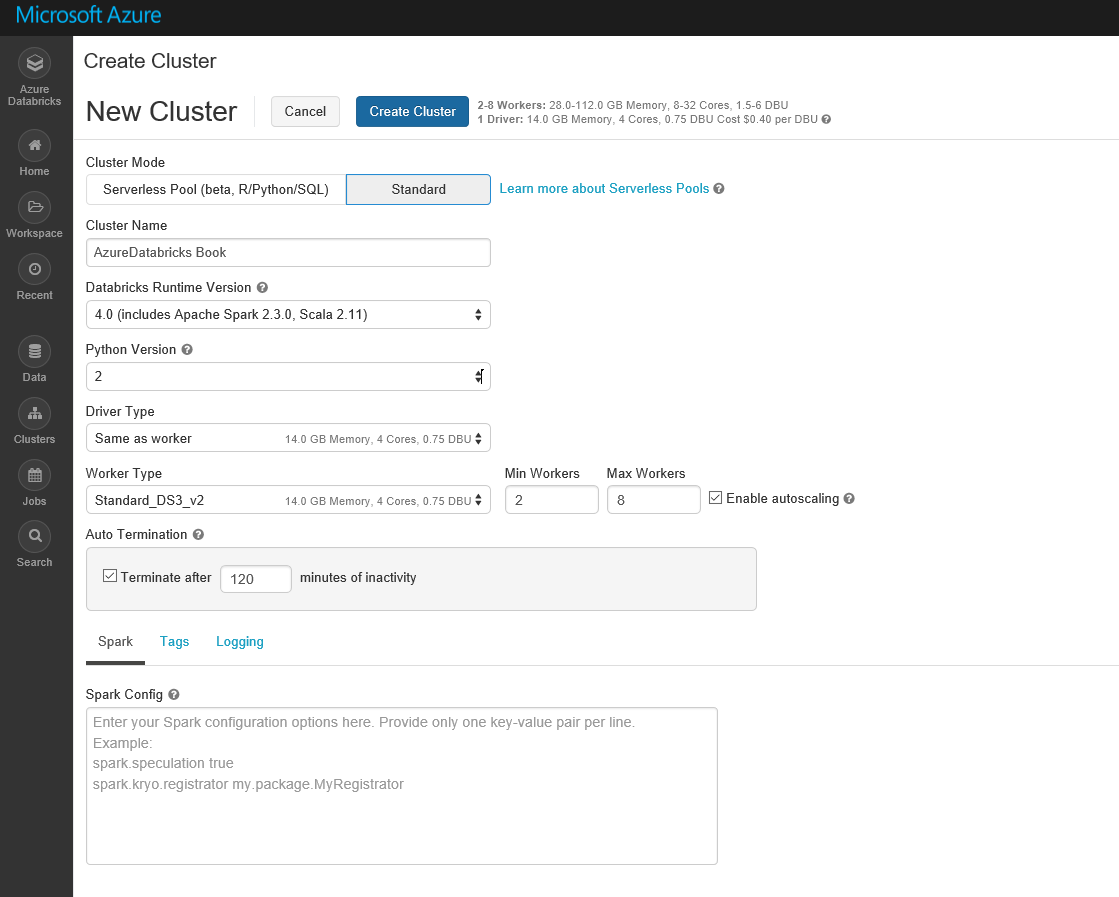
The cluster page can contain both types of clusters. Each cluster can have different nodes. First you need to create a cluster. Click the “Create Cluster” button. On the page that opens, enter information such as the cluster name, version (default), Python version, etc.
To use a cluster, you must wait until the status change is complete (see below). By creating an interactive cluster, we can create a laptop to write codes there and get a quick result.
To create a notebook, click the Workspace button and create a new notebook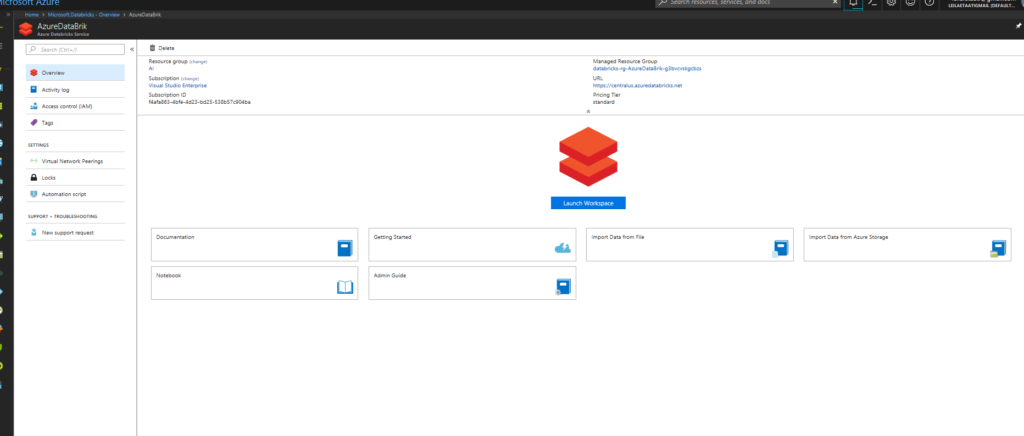
When creating a new notebook, you can specify which notebook belongs to the cluster, and what is the main language for the notebook (Python, Scala, R and SQL). In this example, the default R language is selected. However, you can write other languages on your laptop by writing:% scala. % python,% sql or % r before scripts.
There is room in the address book to write the default codes. As you can see in the figure below, there is an editor named cmd1 as the node to write the codes and run them. In this example, there is only one node, and the main language for writing code is R. In this example, we use an existing dataset in the gpplot2 package named mpg to write the codes below.
library(ggplot2)
display(mpg)
Set the command, show the data set in Databricks
 Set the command, show the data set in Databricks. To run the code, click the arrow on the right side of the node and select Run Cell. Once the code is run, the result appears at the end of the table style cell.
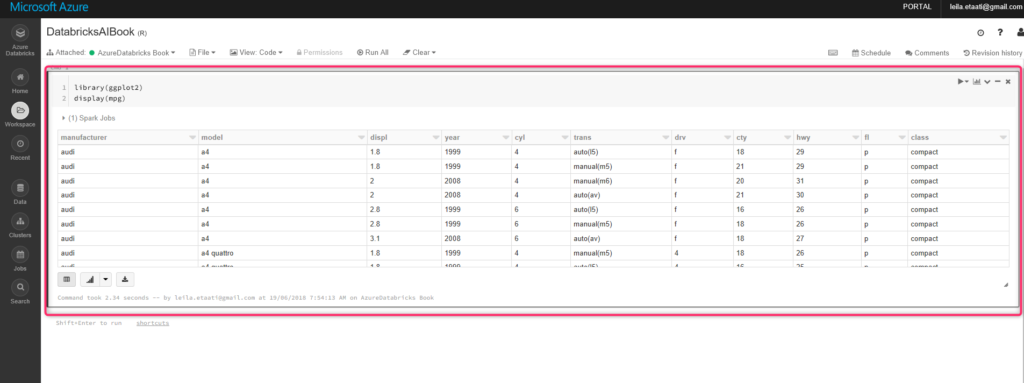
To show the chart, you should click on the chart icon at the bottom of the cell.
![]()
In addition, you can change the item you want to display in the diagram by clicking on the diagram options.
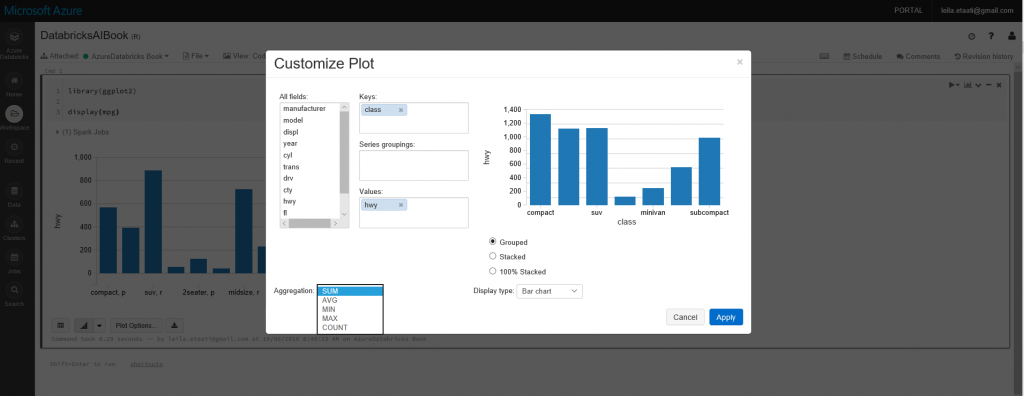 This is a very simple example of using Databricks to run R-scripts. In the next post we will show you how to get data from the Azure Data Lake Store, clear it with Scala, then apply machine learning to it and finally display it in Power BI.
Azure Databricks Tutorial – Data transformations at scale
MORE NEWS
PreambleNoSql is not a replacement for SQL databases but is a valid alternative for many situations where standard SQL is not the best approach for...
PreambleMongoDB Conditional operators specify a condition to which the value of the document field shall correspond.Comparison Query Operators $eq...
5 Database management trends impacting database administrationIn the realm of database management systems, moreover half (52%) of your competitors feel...
The data type is defined as the type of data that any column or variable can store in MS SQL Server. What is the data type? When you create any table or...
PreambleMS SQL Server is a client-server architecture. MS SQL Server process starts with the client application sending a query.SQL Server accepts,...
First the basics: what is the master/slave?One database server (“master”) responds and can do anything. A lot of other database servers store copies of all...
PreambleAtom Hopper (based on Apache Abdera) for those who may not know is an open-source project sponsored by Rackspace. Today we will figure out how to...
PreambleMongoDB recently introduced its new aggregation structure. This structure provides a simpler solution for calculating aggregated values rather...
FlexibilityOne of the most advertised features of MongoDB is its flexibility. Flexibility, however, is a double-edged sword. More flexibility means more...
PreambleSQLShell is a cross-platform command-line tool for SQL, similar to psql for PostgreSQL or MySQL command-line tool for MySQL.Why use it?If you...
PreambleWriting an application on top of the framework on top of the driver on top of the database is a bit like a game on the phone: you say “insert...
PreambleOracle Coherence is a distributed cache that is functionally comparable with Memcached. In addition to the basic function of the API cache, it...
PreambleIBM pureXML, a proprietary XML database built on a relational mechanism (designed for puns) that offers both relational ( SQL / XML ) and...
What is PostgreSQL array? In PostgreSQL we can define a column as an array of valid data types. The data type can be built-in, custom or enumerated....
PreambleIf you are a Linux sysadmin or developer, there comes a time when you need to manage an Oracle database that can work in your environment.In this...
PreambleStarting with Microsoft SQL Server 2008, by default, the group of local administrators is no longer added to SQL Server administrators during the...

