REQUEST COMPLIMENTARY SQLS*PLUS LICENCE
Three performance tuning options for SQL Server
Dynamic administrative views, time statistics and client statistics of SQL Server Management Studio.
Configuring database performance is not the most enjoyable task for database professionals, but neglecting it now costs more than ever. Both developers and administrators have to do it regularly. For example, one of my clients recently asked me to find out the reason for high CPU utilization in an SQL Server environment hosted on an AWS EC2 instance.
For those not familiar with this technology, I will explain that EC2 is a dedicated virtual machine hosted in the Amazon AWS cloud. There are instances of EC2 with different sets of computing resources and fees are charged depending on the CPU and RAM resources provided. Most cloud service providers use similar cost structures, where computing resources and memory are the determinants of resource fees in their environment.
Now that cloud solutions that provide SQL as a service are becoming more widespread, it is important to constantly make efforts to optimize the performance of SQL Server, because for software code with low performance and its impact on the database you pay real money. And that’s in addition to licensing costs depending on the number of cores and the possible loss of customers if the performance drops to such a level that they will start to go to competitors.
There are a number of solutions for diagnosing queries leading to high CPU utilization and stored procedures in Microsoft SQL Server (https://www. microsoft. com/en-us/sql-server-2017), as well as ways to improve the configuration process step by step. These include:
- dynamic administrative concepts;
- time statistics;
- SQL Server Management Studio client statistics.
Consider each of the options so that you can choose the most appropriate setting for your task. Let’s do this based on a test case prepared in a demo environment. I compiled a very simple stored procedure in a test SQL Server instance named Wide World Importers (Listing 1).
I needed to get low performance, so I added a user-defined function as a predicate inside the stored procedure. Each option will show you how to collect in a test environment the initial baseline for the stored procedure that you have to configure to be able to measure improvements during the configuration process.
Option One: Dynamic Administrative Views
There are two dynamic administrative views (DMVs) that are useful for evaluating processor performance and SQL Server query duration: sys. dm_exec_query_stats and sys. dm_exec_procedure_stats. The first provides information about non-regulated queries, the second provides information about stored procedures performed. Otherwise, these views are very similar in structure and results. Each of them returns information about execution with minimum/maximum/medium and last values of all indicators, including I/O (read and write), processor and duration. Since a stored procedure is used as an example, results from dm_exec_procedue_stats are requested. The query shown in Listing 2 provides information about the last execution of the stored procedure.
The last_worker_time and last_elapsed_time values were obtained in microseconds, but I converted them to milliseconds for easy comparison with the other two options discussed in the article. Milliseconds is a more widely used unit of measure for runtime and CPU load time. The results look like the one shown on screen 1.

Screen 1. Results of the first inquiry
Among the advantages of dynamic DMV views are the large amount of information in each of them and the ability to easily combine dynamic administrative views to get even more details than the next version with the time statistics display.
In addition, this information is already cached and the user does not need to make a query every time they need to retrieve the information (assuming that the stored procedure in question has been performed at least once). It’s easy to modify the query to cover information related to the average operating time (CPU load time) and average time spent (the amount of time that consists of not only CPU load time but also CPU wait time through the scheduling engine). It is enough to perform the division by the number of executions.
This is the only of three options that will be a good diagnostic tool for initial selection of procedures to configure: you can build queries to sys. dm_exec_procedure_stats and execute them in a working environment without running the procedures themselves (in a working or test environment). You will be able to see cached behavior because the metadata coming into these DMVs is stored in the cache.
Option two: time statistics
The display of time statistics is enabled and disabled in SQL Server Management Studio (SSMS) at session level with the following command:
SET STATISTICS IO (ON|OFF)
SET STATISTICS TIME ON
EXEC dbo. pOption1;
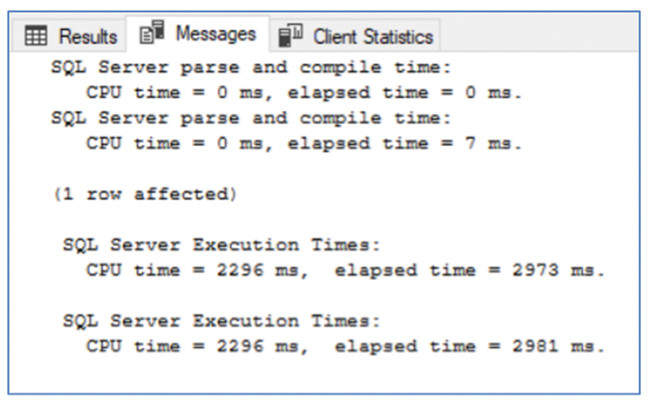
The information is displayed on the Messages tab generated when the request is made in the SSMS, as shown on screen 2.

Screen 2. Session statistics
Time statistics have a number of drawbacks. Thus, the results are calculated only at runtime. In addition, you need to manually mark and calculate the iterative effect of the settings after each change. However, the latter option is very convenient because it does not involve manual calculations of the success or failure of the configuration process. It is more efficient than time statistics.
Option three: view client statistics
This is the most obscure version of the three, which is surprising, because the button to enable the corresponding function is at hand for every user of SQL Server Management Studio (screen 3).

Screen 3. Enabling view of client statistics
This function is also available in the SSMS menu bar at Query\Include Client Statistics or can be enabled using the Shift+Alt+S key combination.
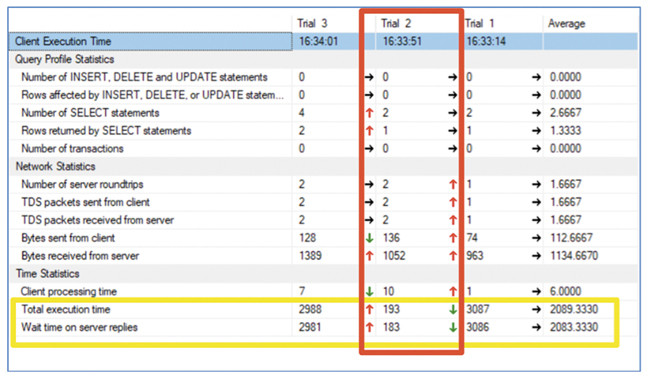
Any of the three options provides an additional tab each time a query is made in the SSMS query window. Each request window is a separate session, and client statistics is different for each execution of any program code in a particular request window. The statistics for the query window corresponding to the query executed in each of the above scenarios is shown on screen 4.

Screen 4. Viewing client statistics
In the example shown on screen 4, you should pay attention to several features. Yellow color highlights the same metrics of CPU load time (working time) and runtime as provided in other options. There are some similarities with the use of dynamic administrative views. The client’s statistics is not limited only by the CPU load time and duration. Therefore, it is suitable for setting other parameters besides the CPU load.
The question may arise as to why the performance on Trial 2 is so different, and this is the problem mentioned earlier: these statistics refer to any program code executed in the current request window. Trial 1 and Trial 3 tests are related to calling EXEC for pOption1, but Trial 2 was the result of code running to clear the buffer pool between executions. Keep these features in mind when iterating the configuration. The “up” and “down” arrows that point to improvements after changing and rerunning the program code are very helpful in iterative tuning.
Thus, as with most tasks, iterative tuning of processor load in SQL Server can be done with the help of several tools. The main thing is to find the best option for you in a particular situation.
Listing 1. Test storage procedure
CREATE PROCEDURE pOption1 AS
BEGIN
SELECT RecordedWhen, A.Temperature
FROM dbo.Temps AS A
WHERE A.Temperature < dbo.OptimalValue(ColdRoomSensorNumber)
AND A.ColdRoomSensorNumber = 1
END
GO
Listing 2: Information on the most recent execution of the stored procedure
SELECT OBJECT_NAME(ePS.object_id,ePS.database_id)
, ePS.execution_count, ePS.last_worker_time / 1000.0 AS last_worker_time_ms
, ePS.last_elapsed_time / 1000.0 AS last_elapsed_time_ms
FROM sys.dm_exec_procedure_stats AS ePS
WHERE OBJECT_NAME(ePS.object_id, ePS.database_id) = 'pOption1';
SQL Server Performance Tuning and Query Optimization
MORE NEWS
PreambleNoSql is not a replacement for SQL databases but is a valid alternative for many situations where standard SQL is not the best approach for...
PreambleMongoDB Conditional operators specify a condition to which the value of the document field shall correspond.Comparison Query Operators $eq...
5 Database management trends impacting database administrationIn the realm of database management systems, moreover half (52%) of your competitors feel...
The data type is defined as the type of data that any column or variable can store in MS SQL Server. What is the data type? When you create any table or...
PreambleMS SQL Server is a client-server architecture. MS SQL Server process starts with the client application sending a query.SQL Server accepts,...
First the basics: what is the master/slave?One database server (“master”) responds and can do anything. A lot of other database servers store copies of all...
PreambleAtom Hopper (based on Apache Abdera) for those who may not know is an open-source project sponsored by Rackspace. Today we will figure out how to...
PreambleMongoDB recently introduced its new aggregation structure. This structure provides a simpler solution for calculating aggregated values rather...
FlexibilityOne of the most advertised features of MongoDB is its flexibility. Flexibility, however, is a double-edged sword. More flexibility means more...
PreambleSQLShell is a cross-platform command-line tool for SQL, similar to psql for PostgreSQL or MySQL command-line tool for MySQL.Why use it?If you...
PreambleWriting an application on top of the framework on top of the driver on top of the database is a bit like a game on the phone: you say “insert...
PreambleOracle Coherence is a distributed cache that is functionally comparable with Memcached. In addition to the basic function of the API cache, it...
PreambleIBM pureXML, a proprietary XML database built on a relational mechanism (designed for puns) that offers both relational ( SQL / XML ) and...
What is PostgreSQL array? In PostgreSQL we can define a column as an array of valid data types. The data type can be built-in, custom or enumerated....
PreambleIf you are a Linux sysadmin or developer, there comes a time when you need to manage an Oracle database that can work in your environment.In this...
PreambleStarting with Microsoft SQL Server 2008, by default, the group of local administrators is no longer added to SQL Server administrators during the...


